Line ratio grids#
Here, we produce and plot grids of line ratios for a variety of complex star formation histories, both as a demonstration of the range of our nebular model(s) and a demonstration of the simulation capability of Lightning.
Imports#
[1]:
import numpy as np
import h5py
rng = np.random.default_rng()
import astropy.units as u
from astropy.table import Table
from corner import corner
import matplotlib.pyplot as plt
plt.style.use('lightning.plots.style.lightning-serif')
%matplotlib inline

from lightning import Lightning
from lightning.priors import UniformPrior, NormalPrior
from lightning.plots import step_curve
from lightning.sfh import DelayedExponentialSFH
Setup#
We create three Lightning objects, loading the Cloudy grids with and without dust grains, and with ULXs from Garofali+(2024) for BPASS stellar population models. Note that the implementation of Garofali et al.’s model doesn’t currently extend into the X-rays - we only use the ULX as an ionizing source. A full implementation is planned; using such models for SED fitting is complicated by the stochastic sampling of the XLF. We currently provide them mainly for simulation purposes.
[2]:
filter_labels = ['SDSS_u'] # We aren't actually using these, 'None' just isn't an option for filter labels.

agebins = [0.0] + list(np.logspace(7, np.log10(13.4e9), 10))

lgh_nodust = Lightning(filter_labels,
                       lum_dist=15, # also isn't going to come up
                       ages=agebins,
                       nebula_lognH=2.0,
                       nebula_dust=False,
                       stellar_type='BPASS-A24',
                       SFH_type='Piecewise-Constant',
                       atten_type='Modified-Calzetti',
                       print_setup_time=True)
print()
lgh_dust = Lightning(filter_labels,
                     lum_dist=15,
                     ages=agebins,
                     nebula_lognH=2.0,
                     nebula_dust=True,
                     stellar_type='BPASS-A24',
                     SFH_type='Piecewise-Constant',
                     atten_type='Modified-Calzetti',
                     print_setup_time=True)

print()
lgh_ULX = Lightning(filter_labels,
                     lum_dist=15,
                     ages=agebins,
                     nebula_lognH=2.0,
                     nebula_dust=True,
                     stellar_type='BPASS-ULX-G24',
                     SFH_type='Piecewise-Constant',
                     atten_type='Modified-Calzetti',
                     print_setup_time=True)
0.001 s elapsed in _get_filters
0.000 s elapsed in _get_wave_obs
1.318 s elapsed in stellar model setup
0.000 s elapsed in dust attenuation model setup
0.000 s elapsed in dust emission model setup
0.000 s elapsed in agn emission model setup
0.000 s elapsed in X-ray model setup
1.319 s elapsed total

0.001 s elapsed in _get_filters
0.000 s elapsed in _get_wave_obs
1.045 s elapsed in stellar model setup
0.000 s elapsed in dust attenuation model setup
0.000 s elapsed in dust emission model setup
0.000 s elapsed in agn emission model setup
0.000 s elapsed in X-ray model setup
1.046 s elapsed total

0.001 s elapsed in _get_filters
0.000 s elapsed in _get_wave_obs
0.933 s elapsed in stellar model setup
0.000 s elapsed in dust attenuation model setup
0.000 s elapsed in dust emission model setup
0.000 s elapsed in agn emission model setup
0.000 s elapsed in X-ray model setup
0.934 s elapsed total
Define SFH templates#
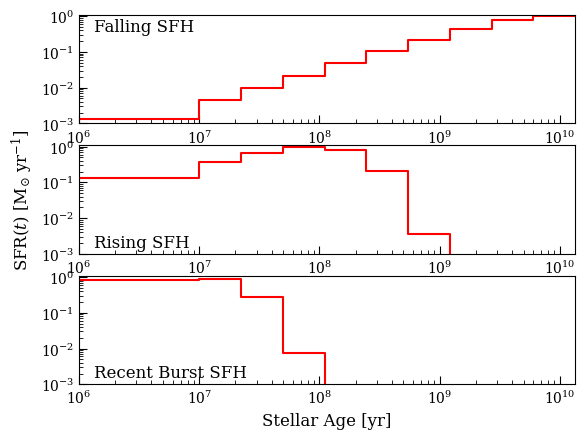
For simplicity we’ll convolve a delayed exponential SFH with the age bins to generate SFH templates. We’ll choose three:
A “falling” SFH that peaked 10 Gyr ago.
A “rising” SFH that peaked 100 Myr ago.
A “recent” SFH that peaked 10 Myr ago.
[3]:
agemid = 0.5 * np.array(agebins[:-1]) + 0.5 * np.array(agebins[1:])
sfh_exp = DelayedExponentialSFH(agemid)


falling_sfh =  sfh_exp.evaluate(np.array([np.exp(1), 1e10]))
rising_sfh = sfh_exp.evaluate(np.array([np.exp(1), 1e8]))
recent_sfh = sfh_exp.evaluate(np.array([np.exp(1), 1e7]))

fig, axs = plt.subplots(3,1)

x,y = step_curve(agebins, falling_sfh)
axs[0].plot(x,y, color='red')

# x,y = step_curve(agebins, rising_sfh)
# axs[1].plot(x,y)
x,y = step_curve(agebins, rising_sfh)
axs[1].plot(x,y, color='red')

# x,y = step_curve(agebins, recent_sfh)
# axs[2].plot(x,y)
x,y = step_curve(agebins, recent_sfh)
axs[2].plot(x,y, color='red')

for i in [0,1,2]:
    axs[i].set_xscale('log')
    axs[i].set_yscale('log')
    axs[i].set_xlim(1e6, 13.4e9)
    axs[i].set_ylim(1e-3, 1.1)

axs[0].text(0.03, 0.97, 'Falling SFH', ha='left', va='top', transform=axs[0].transAxes)
axs[1].text(0.03, 0.03, 'Rising SFH', ha='left', va='bottom', transform=axs[1].transAxes)
axs[2].text(0.03, 0.03, 'Recent Burst SFH', ha='left', va='bottom', transform=axs[2].transAxes)


axs[2].set_xlabel('Stellar Age [yr]')
axs[1].set_ylabel(r'${\rm SFR}(t)~[\rm M_{\odot}~yr^{-1}]$')
[3]:
Text(0, 0.5, '${\\rm SFR}(t)~[\\rm M_{\\odot}~yr^{-1}]$')
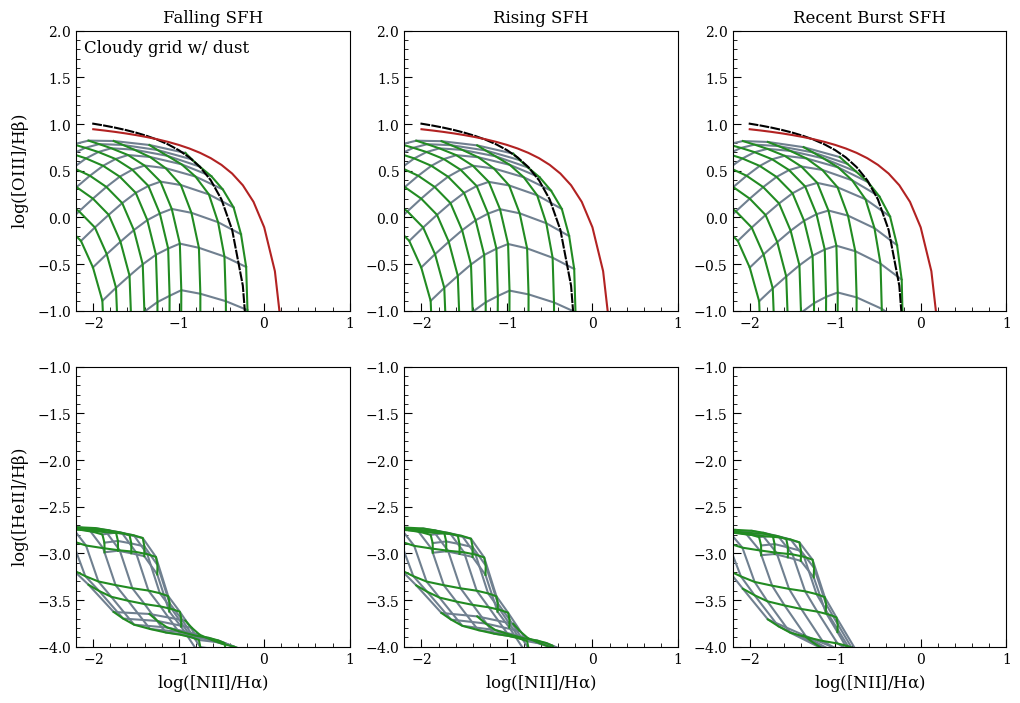
And now we’ll derive grids of line ratios for our various faked SFHs:
Dusty grid#
[4]:
from lightning.plots import k06_NIIplot

Npoints = 10

logU_grid = np.linspace(-4, -1.5, Npoints)
Z_grid = np.logspace(np.log10(0.00075), np.log10(0.02), Npoints)

tauV_grid = np.array([0.0])

fig, axs = plt.subplots(2,3, figsize=(12,8))

linestyle=['-','--']

OIIImask = lgh_dust.stars.line_labels == 'O__3_500684A'
Halphamask = lgh_dust.stars.line_labels == 'H__1_656280A'
Hbetamask = lgh_dust.stars.line_labels == 'H__1_486132A'
NIImask = lgh_dust.stars.line_labels == 'N__2_658345A'

HeIImask = lgh_dust.stars.line_labels == 'HE_2_468568A'

for m,sfh in enumerate([falling_sfh, rising_sfh, recent_sfh]):
    for k,tauV in enumerate(tauV_grid):

        param_array = np.zeros(15)
        param_array[:10] = sfh
        param_array[-3] = tauV

        line_grid = np.zeros((Npoints,Npoints,len(lgh_nodust.stars.line_labels)))

        for i,logU in enumerate(logU_grid):
            for j,Z in enumerate(Z_grid):

                param_array[10] = Z
                param_array[11] = logU

                lines_ext, lines_intr = lgh_dust.get_model_lines(param_array)

                line_grid[i,j,:] = lines_ext.flatten()

        o3hbeta_grid = np.log10(line_grid[:,:,OIIImask] / line_grid[:,:,Hbetamask])
        n2halpha_grid = np.log10(line_grid[:,:,NIImask] / line_grid[:,:,Halphamask])
        he2hbeta_grid =  np.log10(line_grid[:,:,HeIImask] / line_grid[:,:,Hbetamask])

        for i,_ in enumerate(logU_grid):
            axs[0,m].plot(n2halpha_grid[i,:], o3hbeta_grid[i,:], color='slategray', linestyle=linestyle[k])
            axs[1,m].plot(n2halpha_grid[i,:], he2hbeta_grid[i,:], color='slategray', linestyle=linestyle[k])

        for j,_ in enumerate(Z_grid):
            axs[0,m].plot(n2halpha_grid[:,j], o3hbeta_grid[:,j], color='forestgreen', linestyle=linestyle[k])
            axs[1,m].plot(n2halpha_grid[:,j], he2hbeta_grid[:,j], color='forestgreen', linestyle=linestyle[k])

        k06_NIIplot(ax=axs[0,m])
        axs[0,m].set_xlim(-2.2,1)
        axs[0,m].set_ylim(-1,2)

        axs[1,m].set_xlim(-2.2,1)
        axs[1,m].set_ylim(-4,-1)

axs[0,0].set_title('Falling SFH')
axs[0,1].set_title('Rising SFH')
axs[0,2].set_title('Recent Burst SFH')

axs[0,0].set_ylabel(r'$\rm \log([O III] / H\beta)$')
axs[1,0].set_ylabel(r'$\rm \log([He II] / H\beta)$')
for m in [0,1,2]:
    axs[1, m].set_xlabel(r'$\rm \log([N II] / H\alpha)$')

axs[0,0].text(0.03, 0.97, 'Cloudy grid w/ dust', ha='left', va='top', transform=axs[0,0].transAxes)
/Users/eqm5663/Research/code/plightning/lightning/stellar/bpass.py:1409: RuntimeWarning: divide by zero encountered in log10
  np.log10(np.transpose(self.line_lum, axes=[1,2,0,3])),
/Users/eqm5663/miniconda3_arm64/envs/ciao-4.16/lib/python3.11/site-packages/scipy/interpolate/_rgi.py:418: RuntimeWarning: invalid value encountered in multiply
  term = np.asarray(self.values[edge_indices]) * weight[vslice]
[4]:
Text(0.03, 0.97, 'Cloudy grid w/ dust')
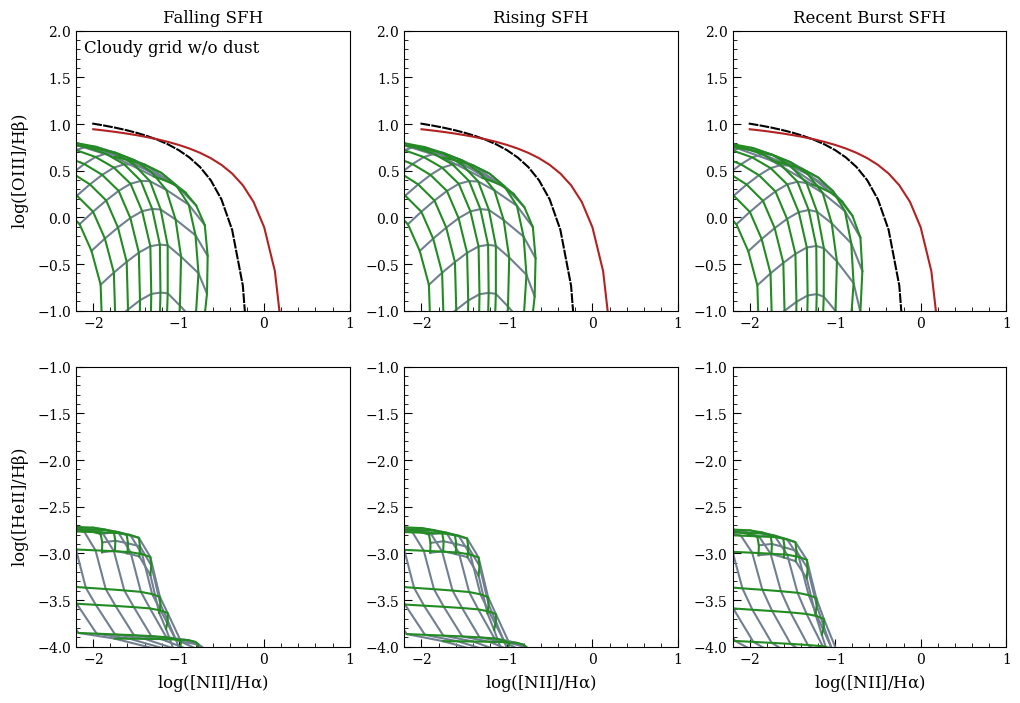
Grid without dust#
[5]:
from lightning.plots import k06_NIIplot

Npoints = 10

logU_grid = np.linspace(-4, -1.5, Npoints)
Z_grid = np.logspace(np.log10(0.00075), np.log10(0.02), Npoints)

tauV_grid = np.array([0.0])

fig, axs = plt.subplots(2,3, figsize=(12,8))

linestyle=['-','--']

OIIImask = lgh_nodust.stars.line_labels == 'O__3_500684A'
Halphamask = lgh_nodust.stars.line_labels == 'H__1_656280A'
Hbetamask = lgh_nodust.stars.line_labels == 'H__1_486132A'
NIImask = lgh_nodust.stars.line_labels == 'N__2_658345A'

HeIImask = lgh_nodust.stars.line_labels == 'HE_2_468568A'

for m,sfh in enumerate([falling_sfh, rising_sfh, recent_sfh]):
    for k,tauV in enumerate(tauV_grid):

        param_array = np.zeros(15)
        param_array[:10] = sfh
        param_array[-3] = tauV

        line_grid = np.zeros((Npoints,Npoints,len(lgh_nodust.stars.line_labels)))

        for i,logU in enumerate(logU_grid):
            for j,Z in enumerate(Z_grid):

                param_array[10] = Z
                param_array[11] = logU

                lines_ext, lines_intr = lgh_nodust.get_model_lines(param_array)

                line_grid[i,j,:] = lines_ext.flatten()

        o3hbeta_grid = np.log10(line_grid[:,:,OIIImask] / line_grid[:,:,Hbetamask])
        n2halpha_grid = np.log10(line_grid[:,:,NIImask] / line_grid[:,:,Halphamask])
        he2hbeta_grid =  np.log10(line_grid[:,:,HeIImask] / line_grid[:,:,Hbetamask])

        for i,_ in enumerate(logU_grid):
            axs[0,m].plot(n2halpha_grid[i,:], o3hbeta_grid[i,:], color='slategray', linestyle=linestyle[k])
            axs[1,m].plot(n2halpha_grid[i,:], he2hbeta_grid[i,:], color='slategray', linestyle=linestyle[k])

        for j,_ in enumerate(Z_grid):
            axs[0,m].plot(n2halpha_grid[:,j], o3hbeta_grid[:,j], color='forestgreen', linestyle=linestyle[k])
            axs[1,m].plot(n2halpha_grid[:,j], he2hbeta_grid[:,j], color='forestgreen', linestyle=linestyle[k])

        k06_NIIplot(ax=axs[0,m])
        axs[0,m].set_xlim(-2.2,1)
        axs[0,m].set_ylim(-1,2)

        axs[1,m].set_xlim(-2.2,1)
        axs[1,m].set_ylim(-4,-1)

axs[0,0].set_title('Falling SFH')
axs[0,1].set_title('Rising SFH')
axs[0,2].set_title('Recent Burst SFH')

axs[0,0].set_ylabel(r'$\rm \log([O III] / H\beta)$')
axs[1,0].set_ylabel(r'$\rm \log([He II] / H\beta)$')
for m in [0,1,2]:
    axs[1, m].set_xlabel(r'$\rm \log([N II] / H\alpha)$')

axs[0,0].text(0.03, 0.97, 'Cloudy grid w/o dust', ha='left', va='top', transform=axs[0,0].transAxes)
[5]:
Text(0.03, 0.97, 'Cloudy grid w/o dust')
Grid with ULXs#
[6]:
from lightning.plots import k06_NIIplot

Npoints = 10

logU_grid = np.linspace(-4, -1.5, Npoints)
Z_grid = np.logspace(np.log10(lgh_ULX.stars.param_bounds[0,0]), np.log10(lgh_ULX.stars.param_bounds[0,1]), Npoints)

tauV_grid = np.array([0.0])

fig, axs = plt.subplots(2,3, figsize=(12,8))

linestyle=['-','--']

OIIImask = lgh_ULX.stars.line_labels == 'O__3_500684A'
Halphamask = lgh_ULX.stars.line_labels == 'H__1_656280A'
Hbetamask = lgh_ULX.stars.line_labels == 'H__1_486132A'
NIImask = lgh_ULX.stars.line_labels == 'N__2_658345A'

HeIImask = lgh_ULX.stars.line_labels == 'HE_2_468568A'

for m,sfh in enumerate([falling_sfh, rising_sfh, recent_sfh]):
    for k,tauV in enumerate(tauV_grid):

        param_array = np.zeros(15)
        param_array[:10] = sfh
        param_array[-3] = tauV

        line_grid = np.zeros((Npoints,Npoints,len(lgh_nodust.stars.line_labels)))

        for i,logU in enumerate(logU_grid):
            for j,Z in enumerate(Z_grid):

                param_array[10] = Z
                param_array[11] = logU

                lines_ext, lines_intr = lgh_ULX.get_model_lines(param_array)

                line_grid[i,j,:] = lines_ext.flatten()

        o3hbeta_grid = np.log10(line_grid[:,:,OIIImask] / line_grid[:,:,Hbetamask])
        n2halpha_grid = np.log10(line_grid[:,:,NIImask] / line_grid[:,:,Halphamask])
        he2hbeta_grid =  np.log10(line_grid[:,:,HeIImask] / line_grid[:,:,Hbetamask])

        for i,_ in enumerate(logU_grid):
            axs[0,m].plot(n2halpha_grid[i,:], o3hbeta_grid[i,:], color='slategray', linestyle=linestyle[k])
            axs[1,m].plot(n2halpha_grid[i,:], he2hbeta_grid[i,:], color='slategray', linestyle=linestyle[k])

        for j,_ in enumerate(Z_grid):
            axs[0,m].plot(n2halpha_grid[:,j], o3hbeta_grid[:,j], color='forestgreen', linestyle=linestyle[k])
            axs[1,m].plot(n2halpha_grid[:,j], he2hbeta_grid[:,j], color='forestgreen', linestyle=linestyle[k])

        k06_NIIplot(ax=axs[0,m])
        axs[0,m].set_xlim(-2.2,1)
        axs[0,m].set_ylim(-1,2)

        axs[1,m].set_xlim(-2.2,1)
        axs[1,m].set_ylim(-4,-1)

axs[0,0].set_title('Falling SFH')
axs[0,1].set_title('Rising SFH')
axs[0,2].set_title('Recent Burst SFH')

axs[0,0].set_ylabel(r'$\rm \log([O III] / H\beta)$')
axs[1,0].set_ylabel(r'$\rm \log([He II] / H\beta)$')
for m in [0,1,2]:
    axs[1, m].set_xlabel(r'$\rm \log([N II] / H\alpha)$')

axs[0,0].text(0.03, 0.97, 'Cloudy grid w/ ULXs', ha='left', va='top', transform=axs[0,0].transAxes)
[6]:
Text(0.03, 0.97, 'Cloudy grid w/ ULXs')
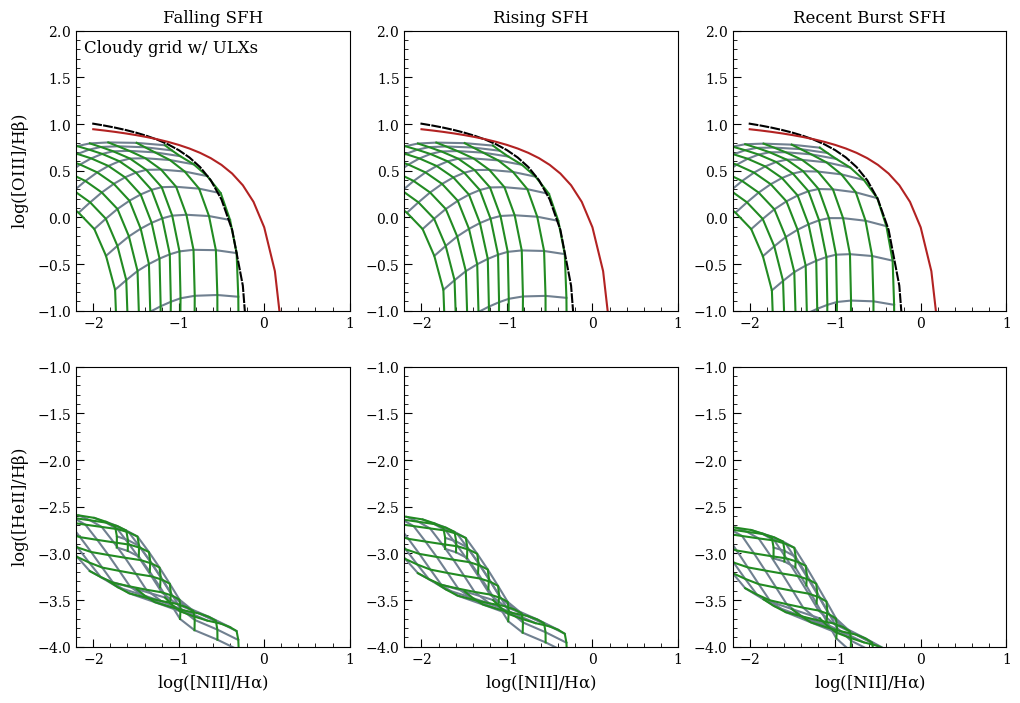
Even our recent burst SFH includes significant dilution of \(\rm [He II] / H\beta\) - it isn’t recent enough or bursty enough.
Overall the line ratios are not particularly sensitive to the SFH (as long as it produces some ionizing photons), since \(\log U\) is an independent parameter from the SFH.